 +1-2404726069 (U.S.)
 0
0qPCR experiments can feel easy and sometimes difficult. After the primer design is completed, qPCR samples are added step by step like PCR, and the experiment can be completed on the machine. There are several common problems in qPCR experiments by dye method and given the possible causes and solutions, we hope you can use them to solve the troubles in qPCR experiments.
1. What is qPCR?
2. Abnormal qPCR amplification curve
3. Abnormal qPCR melting curve
4. Ordering Information
5. Related Products
6. Regarding reading
1. What is qPCR?
Since the polymerase chain reaction technique (PCR) was invented, PCR is probably the most widely used technique in molecular biology due to its simplicity, cheapness, reliability, rapidity, and high sensitivity. qPCR is a technology developed by PCR technology. During the DNA amplification process, the method of detecting the total amount of products after each PCR cycle with fluorescent dyes not only has the rapidity and sensitivity of PCR but also has more specificity and High, real-time monitoring, repeatable and accurate quantification, and other advantages. qPCR is a technology that uses a Quantitative Real Time PCR amplification device, namely a qPCR instrument, to monitor nucleic acid amplification products in real time during the PCR process. qPCR realizes the quantitative analysis of the starting template through the analysis of the Ct value and standard curve. In 1992, Japanese Higuchi first proposed "real-time fluorescent quantitative PCR technology". In 1996, the American Biological Company launched the world's first fluorescent quantitative PCR instrument, which is composed of a PCR amplification thermal cycle system, fluorescence detection optical system, and computer and application software. It can monitor nucleic acid amplification products in real time through fluorescent dyes or fluorescent probes. , through the mathematical function relationship, combined with the software for result analysis, the calculation of the initial template amount of the sample to be tested is realized. Therefore, real-time fluorescent quantitative PCR technology has been widely used. Fluorescent labeling methods for qPCR are divided into fluorescent dye mosaic method based on SYBR Green I dye method, fluorescent probe method based on Taqman probe method (Cycling Probe, Molecular Bracon, etc.), quencher dye primer method.
qPCR experiments can feel easy and sometimes difficult. After the primer design is completed, qPCR samples are added step by step like PCR, and the experiment can be completed on the machine. However, many small details need attention, such as no liquid hanging on the pipe wall, no bubbles in the pipe, and the need to minimize the direct contact between the pipe wall, pipe cover, etc., to reduce experimental errors or strange experimental results. Xiaoyi has compiled several common problems in qPCR experiments by dye method and given the possible causes and solutions, which we hope you can use to solve the troubles in qPCR experiments.
2. Abnormal qPCR amplification curve
2.1 Abnormalities in the baseline phase of the logarithmic plot of the amplification curve
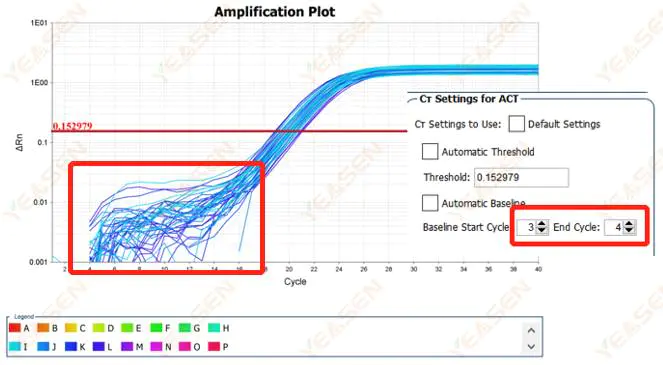
Figure 1. Amplification Plot
Possible causes:
Improper baseline setting.
Solutions:
It is recommended to increase the endpoint value of the baseline. The adjustment example diagram is as follows.
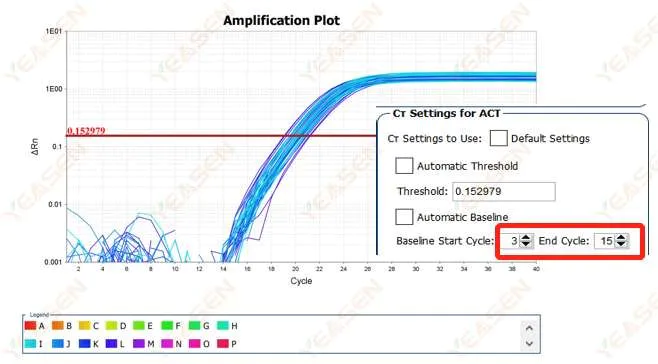
Figure 2. Amplification Plot
2.2 Amplification curve log plot curve segmentation
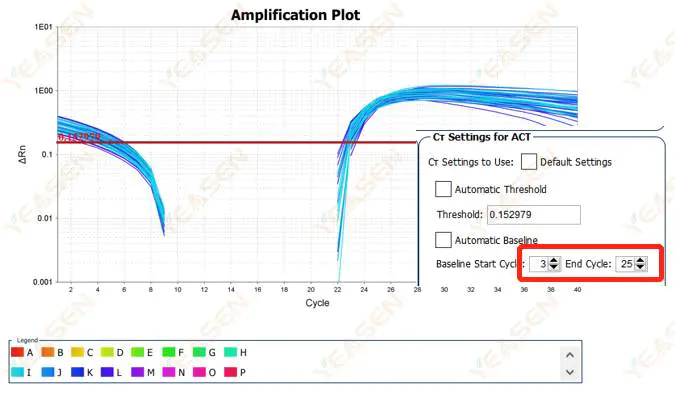
Figure 3. Amplification Plot
Possible causes:
The baseline is set too high.
Solutions:
It is recommended to reduce the endpoint value of the baseline. The adjustment example diagram is as follows.
2.3 Unsmooth amplification curve linearity plot
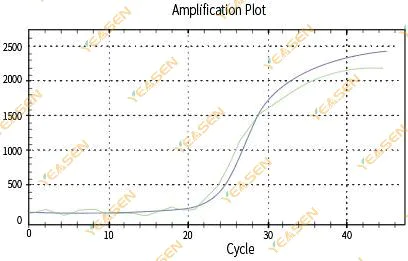
Figure 4. Amplification Plot
Possible causes:
1)The PCR reaction tube was not capped tightly and the reaction solution leaked.
2)PCR reaction solution with hanging wall.
3)The instrument is not calibrated (including automatic calibration or ROX calibration).
4) The system has many inhibitors, leading to unstable fluorescence.
5)Excessive use of the instrument results in unstable fluorescence collection.
Solutions:
1)Press the pipe cover tightly.
2)Thoroughly mix the reagent, and carefully put it into the quantitative instrument after full centrifugation.
3)Calibrate the instrument.
4)Improve RNA purity and select appropriate reverse transcription reagents.
2.4 Amplified curve linear graph zigzag at a plateau
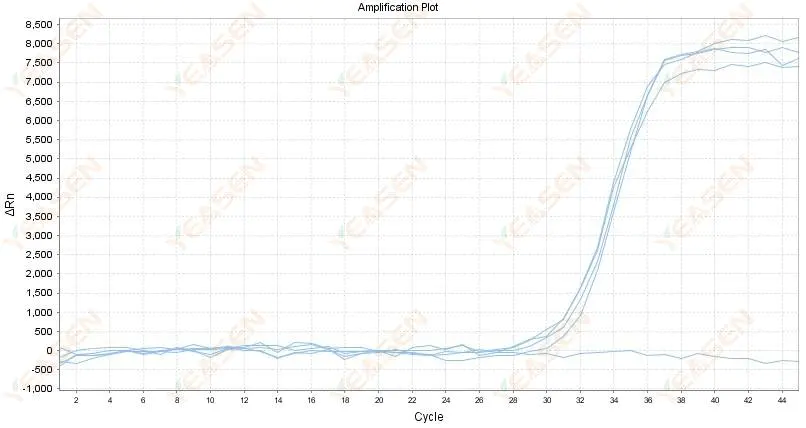
Figure 5. Amplification Plot
Possible causes:
1) The purity of RNA is poor and there are many impurities.
2) The instrument is used for too long.
Solutions:
1) Re extract high-quality RNA.
2) Dilute the RNA template to reduce the concentration of impurities.
3) Calibrate the instrument.
2.5 Linear plot of amplification curve fails to reach a plateau
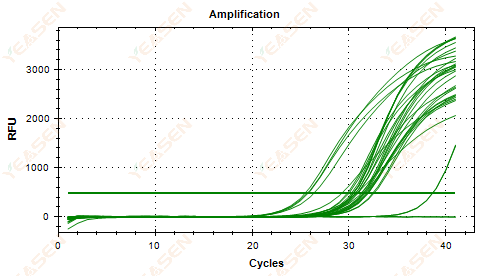
Figure 6. Amplification Plot
Possible causes:
1) Low template concentration (Ct value around 35).
2) Too few amplification cycles.
3) Low efficiency of reagent amplification (small Ct, but also unable to reach plateau).
Solutions:
1) Increase the concentration of the template.
2) Increase the number of cycles.
3) Increasing Mg2+ concentration.
2.6 Amplification curve linear plot plateau sagging
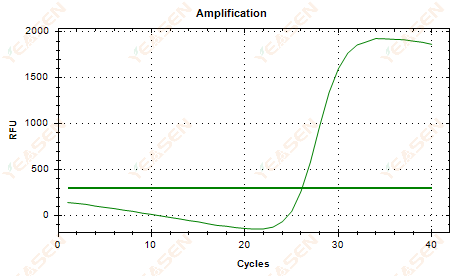
Figure 7. Amplification Plot
Possible causes:
1) Presence of degradation (amplification product degradation, SYBR degradation).
2) The tube cap is not properly covered and the reagent is volatilized.
3) cDNA concentration is too high (if the Ct value is too small, the fluorescence threshold is pulled high, and sagging is more severe).
4) Air bubbles in the tube, then they disappear.
Solutions:
1) Improve system purity.
2) Reduce the cDNA amount (dilute template).
3) Decrease the endpoint value of the baseline.
2.7 Large value of Ct in the amplification curve
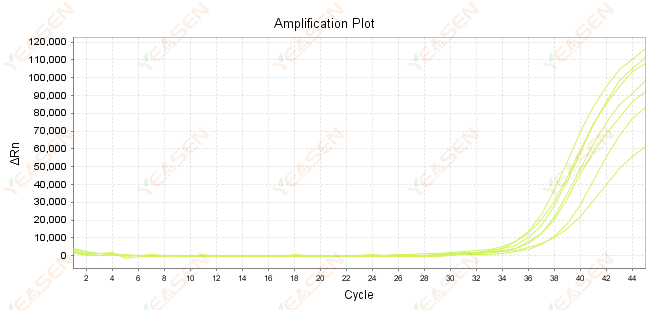
Figure 8. Amplification Plot
Possible causes:
1) Low amount of templates.
2) Low amplification efficiency.
3) PCR fragment is too long.
4) Presence of inhibitors in the reaction system.
Solutions:
1) Reduce the dilution times or increase the amount of template so that the Ct value falls between 15 and 30 as much as possible.
2) Optimize reaction conditions, try a three-step amplification procedure, or redesign primers.
3) PCR product length is designed to be within 100 -150 bp, not recommended to exceed 300 bp.
4) Reproduction of higher purity templates.
2.8 Poor repeatability of amplification curves
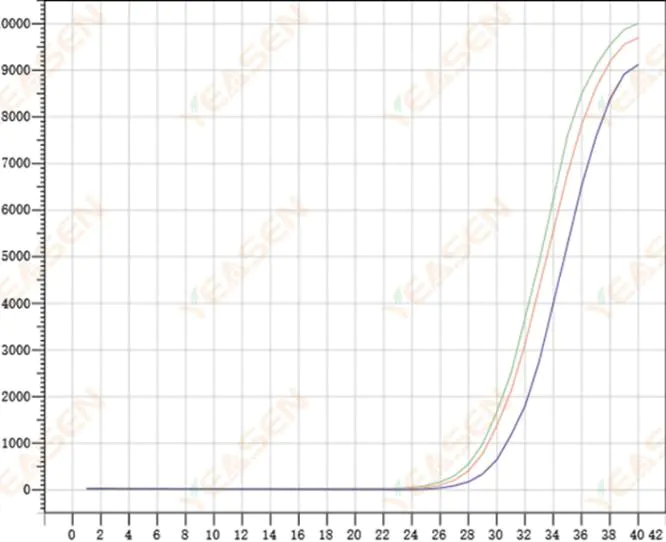
Figure 9. Amplification Plot
Possible causes:
1) Large spiking errors.
2) Reagents and systems are not well mixed.
3) Low copy number of cDNA.
4) No Rox calibration was used.
Solutions:
1) Calibrating pipettes.
2) Thorough mixing of the reaction system.
3) Low template concentration, poor repeatability, 4-6 compound holes, and 1-2 deviations of larger values can be discarded appropriately.
4) It is best to use Rox calibration. If the reagent used does not contain Rox, the reference dye needs to be selected as None.
2.9 Haphazard amplification curves
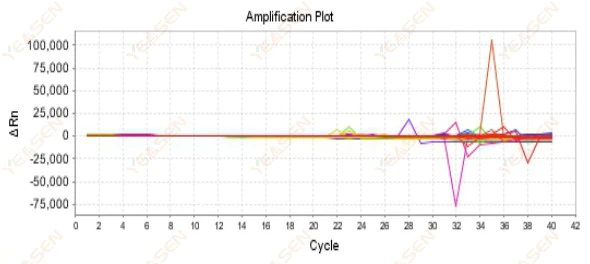
Figure 10. Amplification Plot
Possible causes:
The mismatch between Rox concentration and the model.
Solutions:
Change the reference dye setting on the instrument from ROX to NONE and see if the amplification curve returns to normal.
2.10 NTC Peaking
2.10.1 Ct>35, melting curve Tm value <80℃
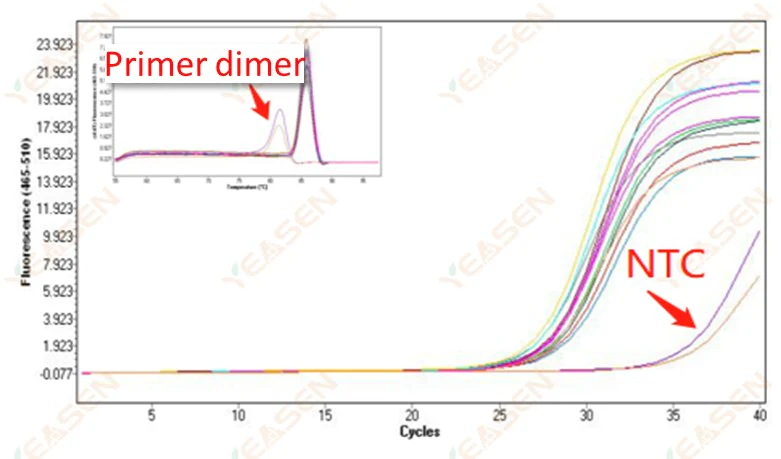
Figure 11. Amplification Plot
Possible causes:
Primer dimerization results.
Solutions:
Optimized primers.
2.10.2 Ct value <35, NTC melting curve and gene melting curve peak shape overlap
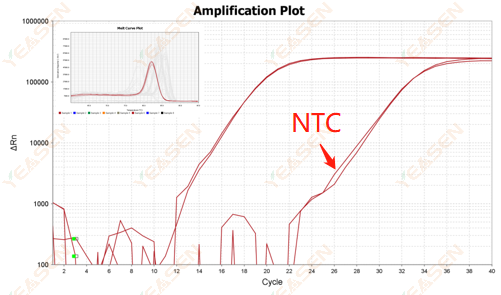
Figure 12. Amplification Plot
Possible causes:
Contamination of reaction system.
Solutions:
Check the pollution sources one by one.
3. Abnormal qPCR melting curve
3.1 Single peak melting curve but not sharp

Figure 13. Melt Curve Plot
Possible causes:
1) It is related to reagent composition and instrument model.
2) Presence of non-specific amplification of similarly sized fragments.
Solutions:
1) The temperature span from peak onset to peak off is not higher than 7°C. The results are considered usable, i.e. single peak.
2) High concentration agarose electrophoresis (e.g. 3% agarose) was performed to assist in the determination.
3.2 The melting curve is double peaked and the lower peak Tm is before 80°C
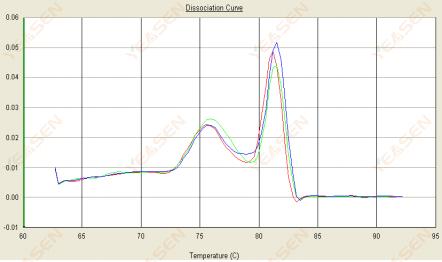
Figure 14. Dissociation Curve
Possible causes:
Presence of primer dimers.
Solutions:
Increase annealing temperature, decrease primer concentration, or redesign primers.
3.3 The melting curve is double peaked and the lower peak Tm is after 80°C
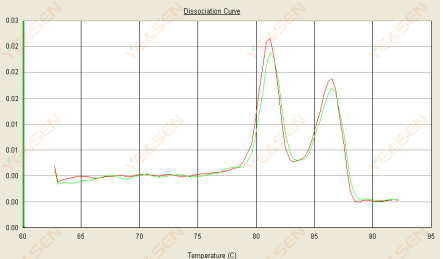
Figure 15. Dissociation Curve
Possible causes:
1) Poor primer specificity leads to the amplification of non-specific products.
2) gDNA contamination.
Solutions:
1) Blast check primer specificity, redesign if poor.
2) Confirmation by NRC negative control, if any, need to the re-prepare template.
3.4 Messy melting curve peaks
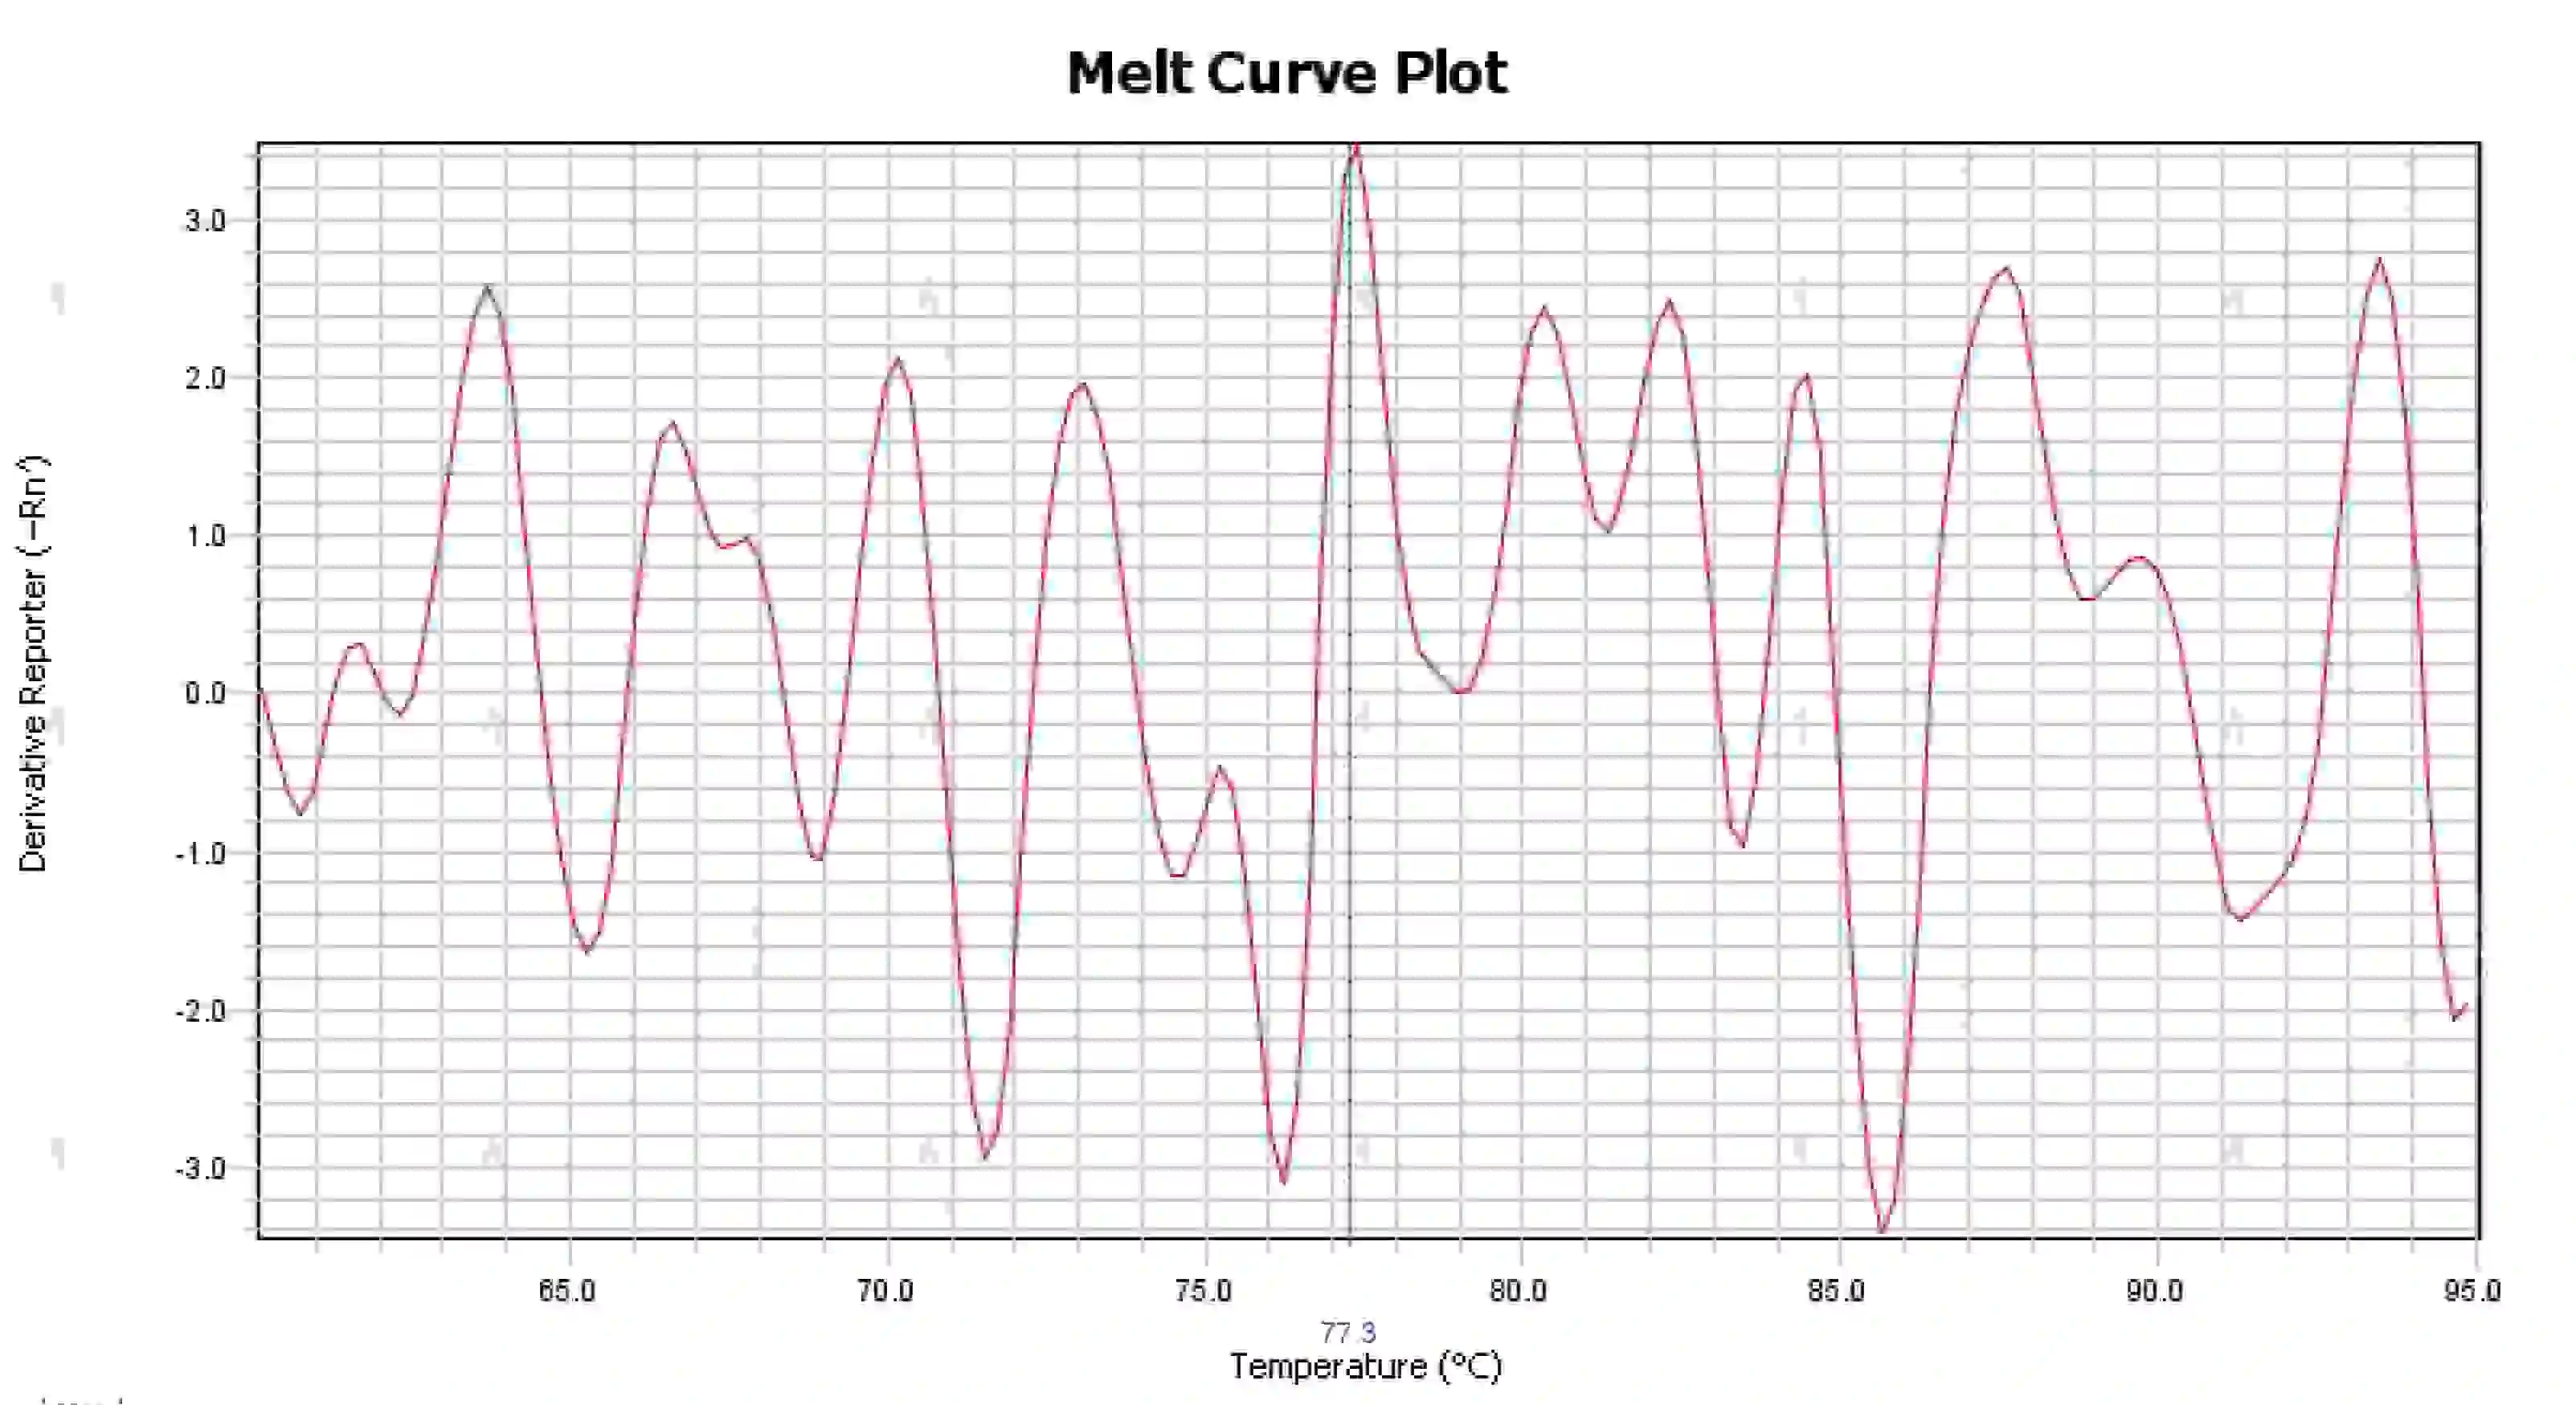
Figure 16. Melt Curve Plot
Possible causes:
1) Contamination of the reaction system.
2) Exposure of reagents to bright light or high temperature leads to reagent failure.
3) Instrument has not been calibrated for a long time.
4) Mismatch between consumables and instruments.
Solutions:
1) Combining NTC and NRC results to confirm contamination, it is recommended to exclude contamination from water, primers, enzymes, and the environment one by one.
2) It is recommended to do comparison experiments with new reagents.
3) Regular instrument calibration maintenance is recommended.
4) Confirm the requirements of the corresponding instrument for consumables.
3.5 Spurious peaks at the front end of the melting curve
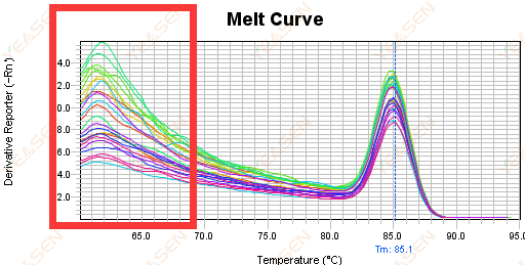
Figure 17. Melt Curve Plot
Possible causes:
Rox concentration does not match the model.
Solutions:
It is recommended to cancel the Rox correction to see if the melting curve is normal.
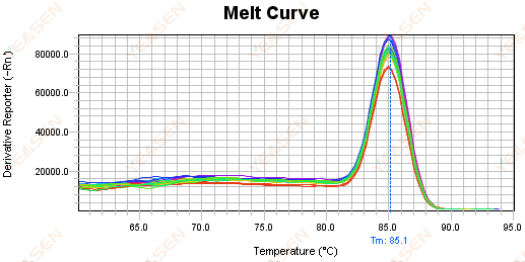
Figure 18. Melt Curve Plot
4. Ordering Information
Table 1. Ordering Information
| Product Name | Product Code | Specification |
| Hieff Unicon™ Universal Blue qPCR Master Mix (Dye Based) | 11184ES03 | 1 mL |
| 11184ES08 | 5×1 mL | |
| 11184ES50 | 50×1 mL | |
| 11184ES60 | 100×1 mL |
5. Related Products
The products provided by Yeasen are as follows.
Table 2. Related Products
| Product Positioning | Product Name | Product Code |
| One-step gDNA removal and reverse transcription | Hifair™V one-step RT-gDNA digestion SuperMix for qPCR (Inquiry) | 11142ES |
| High Sensitivity Master Mix (with gDNA removal step) | Hifair™ III 1st Strand cDNA Synthesis SuperMix for qPCR (gDNA digester plus) | 11141ES |
| High Sensitivity Kit (with gDNA removal step) | Hifair™ III 1st Strand cDNA Synthesis Kit (gDNA digester plus) (Inquiry) | 11139ES |
| Ordinary quantitative master mix (probe method) | Hieff™ qPCR TaqMan Probe Master Mix (Inquiry) | 11205ES |
